
Chart Echo
Chart Echo finds historical chart patterns matching your current setup and shows how those past plays continued.
Visit
About Chart Echo
Chart Echo is a historical pattern matching tool designed for traders and investors who want to study how similar chart setups have played out in the past. Instead of relying on intuition or generic technical indicators, Chart Echo searches approximately 450 million historical windows across stocks and cryptocurrencies to find chart patterns that closely resemble the one you are currently watching. Once it identifies these matches, it overlays the historical pattern on your current chart in gold and shows you the outcome statistics that followed each similar setup. This includes the average move, typical drawdown, and the probability of rising, falling, or going nowhere. The tool is built for active traders who want to validate setups before entering a trade, long-term investors who want to sanity-check breakouts or sell-offs against decades of precedent, and crypto watchers who recognize that digital assets often repeat structural patterns. Chart Echo is not a prediction engine or financial advice; it is a data-driven reference that organizes the market's own historical memory so you can study precedent in seconds. The app guides you through a clear five-step flow: pick a market, frame the pattern, review ranked matches, overlay an echo, and then act by saving the workspace or setting a reminder. It is free to start with no account required, and accounts unlock saved workspaces and additional features.
Features of Chart Echo
Massive Historical Database
Chart Echo searches approximately 450 million historical windows across stocks and cryptocurrencies to find patterns that match your current chart. This vast database covers years of market data, allowing the tool to identify even subtle structural similarities that would take hours or days to find manually. The search is instantaneous, giving you a ranked list of the closest historical echoes along with a similarity score and explanation of why each pattern rhymes.
Historical Overlay with Outcome Statistics
Once a match is found, Chart Echo overlays the historical pattern on your current chart in gold, allowing you to visually compare the two setups side by side. Beyond the visual overlay, the tool aggregates the continuations of all matched patterns to show you honest, data-grounded outcome statistics. You see the average move that followed, the typical drawdown along the way, and the probability of different outcomes, giving you a clear picture of what precedent suggests.
Five-Step Guided Flow
The app walks you through a single, guided path that mirrors the mobile experience. You start by picking a stock or crypto ticker, then set the timeframe and define how many candles constitute the pattern. After running the search, you review a ranked list of historical echoes, overlay a selected match on your live chart, and finally act by saving the workspace, setting a reminder, watching for new fractals, or sharing a Story GIF. This structured flow eliminates guesswork and blank canvases.
Multi-Asset Support
Chart Echo works with both stocks and cryptocurrencies, covering major markets and popular tickers. For crypto, the tool matches BTC, ETH, and other major coins against their own past structure and across different assets, recognizing that crypto markets often repeat patterns more aggressively than traditional equities. This cross-asset capability allows you to see if a setup in one market has precedent in another, broadening your analytical perspective.
Use Cases of Chart Echo
Pre-Trade Validation for Active Traders
Before taking a setup, active traders can use Chart Echo to see the closest historical analogs to their current chart pattern. The tool shows how those analogs resolved over the following weeks, including the odds of success, average move, and typical drawdown. This data-driven validation helps traders avoid emotional decisions and base their entries on actual market precedent rather than gut feeling or hype.
Sanity-Checking Breakouts for Long-Term Investors
Long-term investors can use Chart Echo to sanity-check a breakout or a sell-off against decades of precedent instead of relying on a single analyst's opinion. By overlaying historical patterns that looked similar, investors can see how the market behaved after those moments, helping them decide whether to hold, add to a position, or take profits. This turns subjective chart reading into an objective historical comparison.
Crypto Pattern Recognition
Crypto traders and watchers can leverage Chart Echo to identify recurring structures in digital assets. Crypto markets are known for repeating patterns like blow-off tops and capitulation lows, and Chart Echo matches these against the asset's own history and across other cryptocurrencies. This allows crypto users to spot where today's chart has happened before and study the typical aftermath of similar fractal projections.
Educational Chart Study
Newer traders and students of technical analysis can use Chart Echo as a learning tool to understand how patterns resolve over time. By searching historical matches for any chart they are studying, they can see real examples of similar setups and their outcomes. This builds pattern recognition skills and provides a library of historical case studies without requiring years of manual chart scrolling.
Frequently Asked Questions
How does Chart Echo find matching patterns?
Chart Echo uses a proprietary fractal matching algorithm that analyzes the shape of your current chart pattern and searches its database of approximately 450 million historical windows. It compares the structure of price movements, not just specific price levels or indicators. The algorithm ranks matches by how closely they rhyme with your current pattern and provides a similarity score. It then extracts the continuation data from each match to compute outcome statistics.
Is Chart Echo a prediction tool?
No, Chart Echo is not a prediction tool and does not provide financial advice. It is a historical reference tool that shows you how similar chart patterns played out in the past. The outcome statistics are based on real historical data, not forecasts. The tool explicitly states that it is the market's own memory organized for study, and users should always conduct their own research and consider current market conditions before making any trading or investment decisions.
What assets are supported by Chart Echo?
Chart Echo supports both stocks and cryptocurrencies. For stocks, it covers major exchanges and popular tickers. For crypto, it supports major coins like Bitcoin (BTC) and Ethereum (ETH) as well as other significant digital assets. The tool can match patterns across different assets, meaning you can see if a setup in one stock or crypto has historical precedent in another market. The exact list of supported tickers is available within the app.
Do I need to create an account to use Chart Echo?
No, you can try Chart Echo for free without signing up. The free tier allows you to search for historical matches and view outcome statistics. Creating a free account unlocks additional features like saving workspaces so you can return to your analysis later. Premium accounts add Pro Mode, saved-setup reminders, intraday timeframes, alerts for new fractals, and watermark-free exports for sharing charts and GIFs.
Similar to Chart Echo
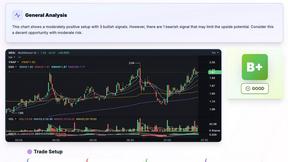
SnapPChart
SnapPChart grades a trading chart screenshot A+ to F, with an entry, stop, targets, and risk/reward. Works on stocks, forex, crypto, futures.

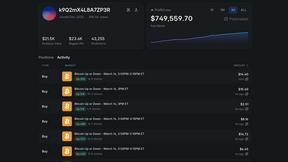
Polymarket Trading Bot For Crypto
This Polymarket trading bot automates high-frequency arbitrage and directional strategies on short-term crypto Up or Down markets with full source.